
My Real Estate Blog - Market Trends, Tips & Updates
Canadian home sales activity eases in October
11/15/2018 | Posted in Canadian Housing Market by Paul DeAdder | Back to Main Blog Page

Statistics released today by the Canadian Real Estate Association (CREA) show national home sales declined between September and October 2018.
Highlights:
- National home sales fell 1.6% from September to October.
- Actual (not seasonally adjusted) activity was down by 3.7% from one year ago.
- The number of newly listed homes eased 1.1% from September to October.
- The MLS® Home Price Index (HPI) was up 2.3% year-over-year (y-o-y) in October.
- The national average sale price slipped by 1.5% y-o-y in October.
Monthly home sales (CNW Group/Canadian Real Estate Association)
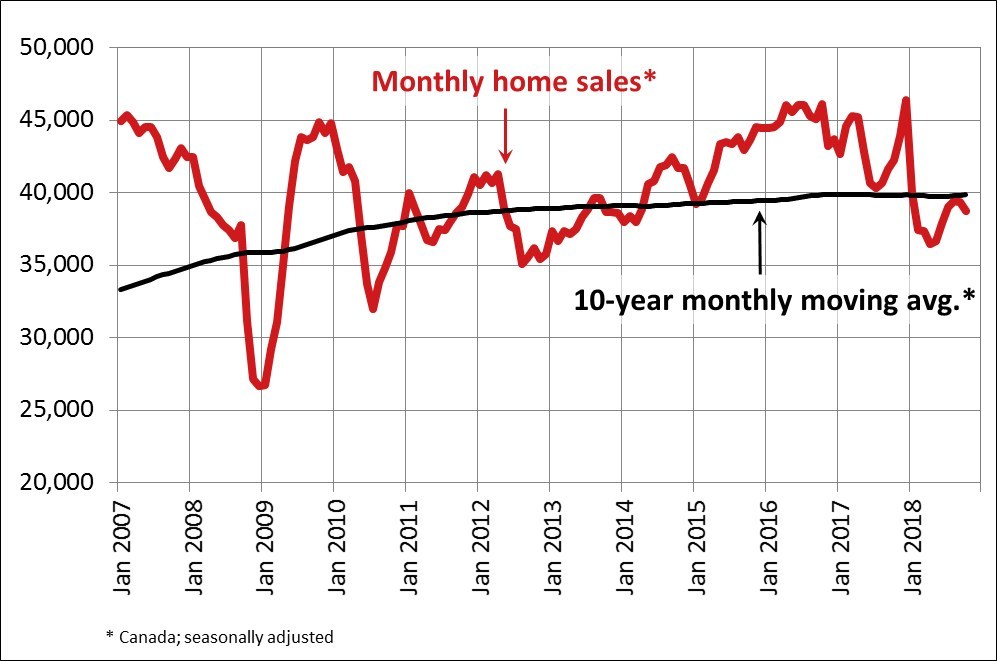
Home sales via Canadian MLS® Systems edged back by 1.6% in October 2018. While activity is still stronger compared to the first half of 2018, it remains below monthly levels recorded from early 2014 through 2017.
Transactions declined in more than half of all local markets, led by Hamilton-Burlington, Montreal and Edmonton. Although activity did improve modestly in many markets, it was offset by a decline in sales elsewhere by a factor of two.
Actual (not seasonally adjusted) activity was down 3.7% compared to October 2017 and in line with the 10-year average for the month. While sales were down y-o-y in slightly more than half of all local markets in October, lower sales in Greater Vancouver and the Fraser Valley more than offset the rise in sales in the Greater Toronto Area (GTA) and Montreal by a wide margin.
"This year's new mortgage stress-test has lowered how much mortgage home buyers can qualify for across Canada, but its effect on sales has varied somewhat depending on location, housing type and price range," said CREA President Barb Sukkau. "All real estate is local. A professional REALTOR® is your best source for information and guidance in negotiating a purchase or sale of a home during these changing times," added Sukkau.
"National sales activity lost momentum in October," said Gregory Klump, CREA's Chief Economist. "In part, this reflects waning activity among some urban centers in Ontario's Greater Golden Horseshoe region and the absence of an offsetting rise in sales in the Lower Mainland of British Columbia. Even so, the balance between sales and listings in these regions points to stable prices or modest gains. By contrast, the balance between sales and listings for housing markets in Alberta,Saskatchewan and Newfoundland indicates a weak pricing environment for homeowners who are looking to sell."
The number of newly listed homes edged down 1.1% between September and October, led by the GTA, Calgary andVictoria. The decline in new supply among these markets more than offset an increase in new supply in Edmonton andGreater Vancouver.
As for the balance between sales and listings, the national sales-to-new listings ratio in October came in at 54.2% — close to September's reading of 54.4% and its long-term average of 53.4%.
Considering the degree and duration to which market balance readings are above or below their long-term average is the best way of gauging whether local housing market conditions favour buyers or sellers. As a rule of thumb, measures of market balance that are within one standard deviation of their long-term average are generally consistent with balanced market conditions.
Based on a comparison of the sales-to-new listings ratio with the long-term average, about two-thirds of all local markets were in balanced market territory in October 2018.
The number of months of inventory is another important measure for the balance between sales and the supply of listings. It represents how long it would take to liquidate current inventories at the current rate of sales activity.
There were 5.3 months of inventory on a national basis at the end of October 2018. While this remains in line with its long-term national average, the number of months of inventory is well above its long-term average in the Prairie provinces and in Newfoundland & Labrador. By contrast, Ontario and Prince Edward Island are the two provinces where the measure remains more than one standard deviation below its long-term average. In other provinces, the number of months of inventory is closer to its long-term average and suggests that sales and inventory are well balanced.
The Aggregate Composite MLS® Home Price Index (MLS® HPI) was up 2.3% y-o-y in October 2018 with similar gains posted in each of the three previous months.
Apartment units posted the largest y-o-y price gains in October (+7.4%), followed by townhouse/row units (+3.9%). By comparison, one-storey single-family homes posted a modest increase (+0.6%) while two-storey single-family home prices held steady.
Trends continue to vary widely among the 17 housing markets tracked by the MLS® HPI. In British Columbia, home price gains have been diminishing on a y-o-y basis (Greater Vancouver: +1%; Fraser Valley: +6.8%; Victoria +8.5%; elsewhere on Vancouver Island: +11.8%).
By contrast, MLS® HPI benchmark price comparisons are improving on a y-o-y basis among housing markets in the Greater Golden Horseshoe region that are tracked by the index. Home prices were up from year-ago levels in Guelph(+9.3%), Hamilton-Burlington (+6.8%), the Niagara Region (+6.3%), the GTA (+2.6%) and Oakville-Milton (+2.2%). While home prices in Barrie and District remain slightly below year-ago levels (-0.9%), declines there are shrinking; if current price momentum persists, home prices in December are on track to turn positive compared to December 2017.
Across the Prairies, benchmark home prices remained below year-ago levels in Calgary (-2.6%), Edmonton (-2.4%), Regina(-3.6%) and Saskatoon (-0.9%).
Home prices rose by 6.6% y-o-y in Ottawa (led by a 7.4% increase in two-storey single-family home prices), by 6.3% inGreater Montreal(led by a 9.8% increase in townhouse/row unit prices) and by 4.2% in Greater Moncton (led by a 12.4% increase in townhouse/row unit prices).
The MLS® HPI provides the best way to gauge price trends because average price trends are strongly distorted by changes in the mix of sales activity from one month to the next.
The actual (not seasonally adjusted) national average price for homes sold in October 2018 was just under $496,800, down 1.5% from the same month last year.
The national average price is heavily skewed by sales in Greater Vancouver and the GTA, two of Canada's most active and expensive markets. Excluding these two markets from calculations cuts almost $114,000 from the national average price, trimming it to just under $383,000.
Source: CREA
