
My Real Estate Blog - Market Trends, Tips & Updates
Canadian home sales drop sharply in February 2019
3/15/2019 | Posted in Canadian Housing Market by Paul DeAdder | Back to Main Blog Page

Statistics released today by the Canadian Real Estate Association (CREA) show national home sales dropped sharply from January to February 2019.
Highlights:
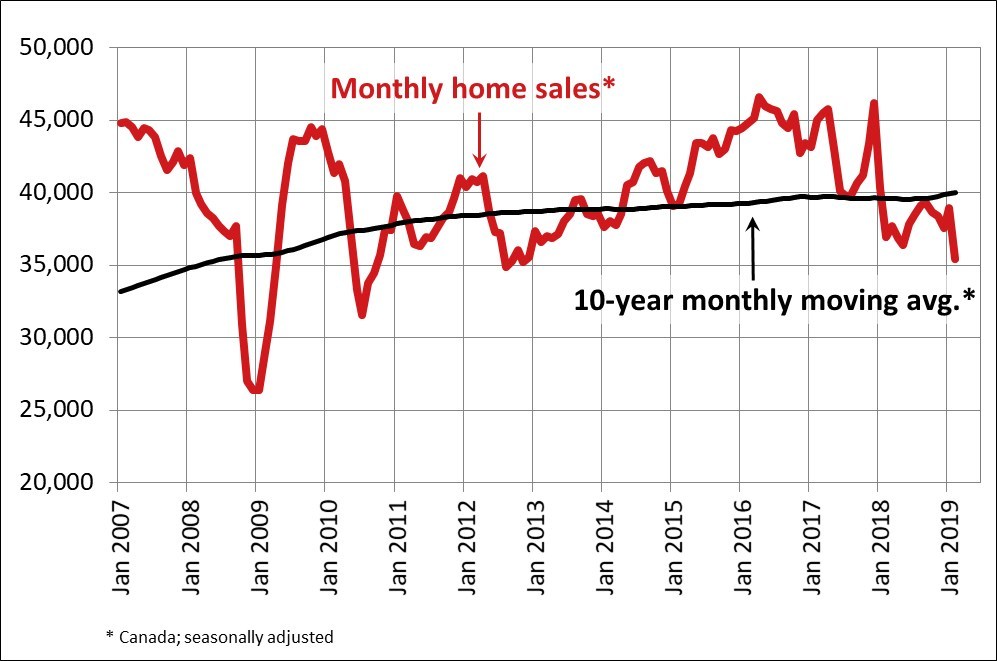
- National home sales plummeted 9.1% month-over-month (m-o-m) in February.
- Actual (not seasonally adjusted) activity was down 4.4% year-over-year (y-o-y).
- The number of newly listed homes fell 3.2% m-o-m.
- The MLS® Home Price Index (HPI) was virtually unchanged (-0.1% y-o-y).
- The national average sale price fell by 5.2% y-o-y.
Home sales via Canadian MLS® Systems plunged 9.1% m-o-m in February 2019 to the lowest level since November 2012. The month-over-month decline was the largest recorded since the B-20 stress test came into effect in January of last year.
The number of homes trading hands was down from the previous month in three-quarters of all local markets, including all major cities.
Actual (not seasonally adjusted) sales activity was down 4.4% to reach the lowest level for month of February since 2009. It was also almost 12% below the 10-year February average. In British Columbia, Alberta as well as Newfoundland and Labrador, sales were more than 20% below their 10-year average for the month.
"For aspiring homebuyers being kept on the sidelines by the mortgage stress-test, it's a bitter pill to swallow when policy makers say the policy is working as intended," said Barb Sukkau. "Fewer qualified buyers means sellers are affected too. The impact of tighter mortgage regulations differs by local housing market and a professional REALTOR® remains your best source for information and guidance in negotiating the purchase or sale of a home during these changing times," added Sukkau.
"February home sales declined across a broad swath of large and smaller Canadian cities," said Gregory Klump, CREA's Chief Economist. "The housing sector is on track to further reduce waning Canadian economic growth. Only time will tell whether successive changes to mortgage regulations went too far, since the impact of policy decisions becomes apparent only well after the fact. Hopefully policy makers are thinking about how to fine tune regulations to better keep housing affordability within reach while keeping lending risks in check."
The number of newly listed homes declined by 3.2% in February, led by GTA regional municipalities that surround the City of Toronto, in addition to Hamilton-Burlington, Calgary, Edmonton and Winnipeg.
With sales down by more than new listings in February, the national sales-to-new listings ratio eased to 54.1% compared to 57.6% in January. Looking beyond its monthly volatility, this measure of market balance has remained close to the long-term average of 53.5% since early 2018.
Considering the degree and duration to which market balance readings are above or below their long-term averages is the best way of gauging whether local housing market conditions favour buyers or sellers. Market balance measures that are within one standard deviation of their long-term average are generally consistent with balanced market conditions.
Based on a comparison of the sales-to-new listings ratio with the long-term average, about 70% of all local markets were in balanced market territory in February 2019.
The number of months of inventory is another important measure of the balance between sales and the supply of listings. It represents how long it would take to liquidate current inventories at the current rate of sales activity.
There were 5.7 months of inventory on a national basis at the end of February 2019, a three-and-a-half-year high and a little above its long-term average of 5.3 months. That said, there are significant regional differences. The number of months of inventory has swollen far above its long-term average in Prairie provinces and Newfoundland & Labrador; as a result, homebuyers there have an ample choice of listings available for purchase. By contrast, the measure remains well below its long-term average in Ontario and the Maritimes.
The Aggregate Composite MLS® Home Price Index (MLS® HPI) was little changed (-0.1%) y-o-y in February 2019. That said, it still marked the first decline in almost a decade.
Apartment units recorded a y-o-y price increase of 2.4% in February, while townhouse/row unit prices were up 1%. By comparison, one and two-storey single-family home prices were down 1.7% and 1% y-o-y in February.
Trends continue to vary widely among the 17 housing markets tracked by the MLS® HPI. Results remain mixed in British Columbia, with prices down on a y-o-y basis in Greater Vancouver (-6.1%) and the Fraser Valley (-2.8%). By contrast, prices posted a y-o-y increase of 3% in Victoria and were up 7.7% elsewhere on Vancouver Island.
Among Greater Golden Horseshoe housing markets tracked by the index, MLS® HPI benchmark home prices were up from year-ago levels in Guelph (+6.8%), the Niagara Region (+6.5%), Hamilton-Burlington (+5%) and the GTA (+2.3%). By contrast, home prices were little changed (+0.2%) on a y-o-y basis in Oakville-Milton, while in Barrie and District prices remain below year-ago levels (-4.3%).
Across the Prairies, supply is historically elevated relative to sales and home prices are down from year-ago levels. Benchmark prices were down by 4.4% in Calgary, 4.5% in Edmonton, 5.1% in Regina and 3% in Saskatoon. The home pricing environment will likely remain weak in these cities until demand and supply come back into better balance.
Home prices rose 7.4% y-o-y in Ottawa (led by a 10.8% increase in townhouse/row unit prices), 6.2% in Greater Montreal (led by a 7.8% increase in apartment unit prices) and 1.6% in Greater Moncton (led by a 7.9% increase in townhouse/row unit prices).
The MLS® HPI provides the best way to gauge price trends, as averages are strongly distorted by changes in the mix of sales activity from one month to the next.
The actual (not seasonally adjusted) national average price for homes sold in February 2019 was $468,350, down 5.2% from the same month in 2018.
The national average price is heavily skewed by sales in Greater Vancouver and the GTA, two of Canada's most active and expensive markets. Excluding these two markets from calculations cuts close to $100,000 from the national average price, trimming it to just under $371,000.
Source: CREA
