
My Real Estate Blog - Market Trends, Tips & Updates
Canadian home sales fall further in December
1/15/2019 | Posted in Canadian Housing Market by Paul DeAdder | Back to Main Blog Page

Statistics released today by the Canadian Real Estate Association (CREA) show national home sales posted a fourth-straight monthly decline in December 2018.
Highlights:
- National home sales fell 2.5% from November to December.
- Actual (not seasonally adjusted) activity was down by 19% from one year ago.
- The number of newly listed homes was little changed from November to December.
- The MLS® Home Price Index (HPI) was up 1.6% year-over-year (y-o-y) in December.
- The national average sale price fell by 4.9% y-o-y in December.
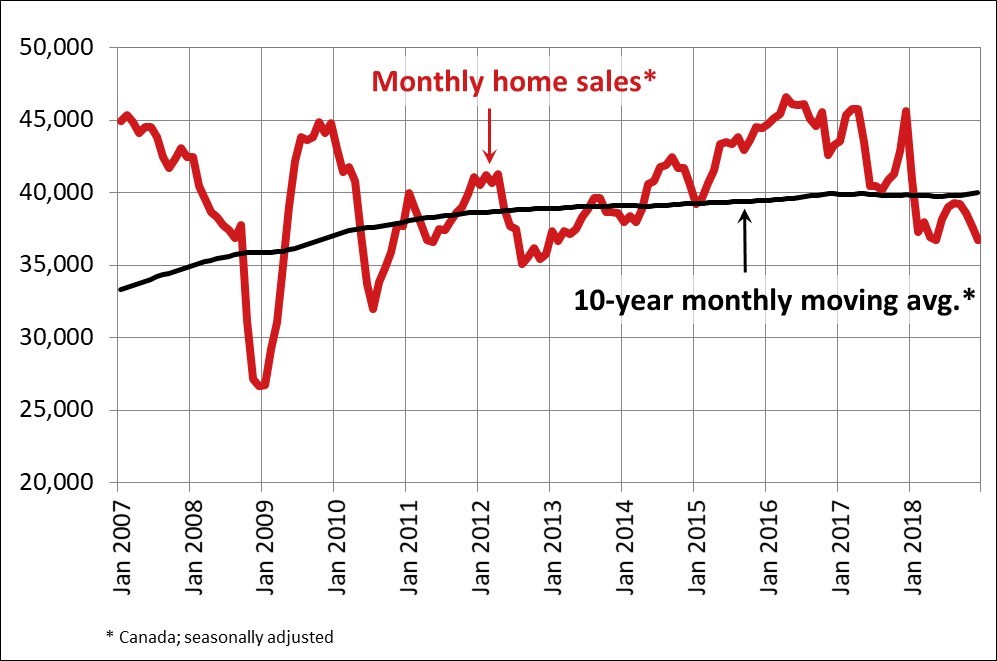
Home sales via Canadian MLS® Systems fell by 2.5% in December 2018compared to November, capping the weakest annual sales since 2012. Monthly declines in activity since September have fully retrenched its summer rally and returned it near the lowest level since early 2013.
Transactions declined in about 60% of all local markets in December, led by lower activity in Greater Vancouver, Vancouver Island, Ottawa, London & St. Thomas, and Halifax-Dartmouth, together with a regionally diverse mix of other large and medium sized urban centres.
Actual (not seasonally adjusted) activity was down 19% y-o-y in December 2018 and stood almost 12% below the 10-year average for the month of December. Sales were down from year-ago levels in three-quarters of all local markets, led overwhelmingly by the Lower Mainland of British Columbia, the Okanagan Region, Calgary, Edmonton, the Greater Toronto Area and Hamilton-Burlington.
This decline, in part, is due to elevated activity posted in December 2017as home buyers rushed to purchase in advance of the new federal mortgage stress test that came into effect on January 1, 2018.
"What a difference a year makes," said CREA President Barb Sukkau. "Sales trends were pushed higher in December 2017 by home buyers rushing to purchase before the new federal mortgage stress-test took effect at the beginning of 2018. Since then, the stress-test has weighed on sales to varying degrees in all Canadian housing markets and it will continue to do so this year. All real estate is local. A professional REALTOR® remains your best source for information and guidance in negotiating the purchase or sale of a home during these changing times," added Sukkau.
"The Bank of Canada recently said that it expects housing activity will stay 'soft' as households 'adjust to the mortgage stress-test and increases in mortgage rates,' even as jobs and incomes continue growing," said Gregory Klump, CREA's Chief Economist. "Indeed, the Bank's economic forecast shows it expects housing will undermine economic growth this year as the mortgage stress test has pushed home ownership affordability out of reach for some home buyers," he added.
The number of newly listed homes remained little changed (+0.2%) from November to December, with declines in close to half of all local markets offset by gains in the remainder.
With sales down and new listings steady in December, the national sales-to-new listings ratio eased to 53.3% compared to 54.8% in November. This measure of market balance has remained close to its long-term average of 53.5% since the beginning of 2018.
Considering the degree and duration to which market balance readings are above or below their long-term averages is the best way of gauging whether local housing market conditions favour buyers or sellers. Market balance measures that are within one standard deviation of their long-term average are generally consistent with balanced market conditions.
Based on a comparison of the sales-to-new listings ratio with the long-term average, about two-thirds of all local markets were in balanced market territory in December 2018.
The number of months of inventory is another important measure for the balance between sales and the supply of listings. It represents how long it would take to liquidate current inventories at the current rate of sales activity.
There were 5.6 months of inventory on a national basis at the end of December 2018. While this remains close to its long-term average of 5.3 months, the number of months of inventory has swollen far above its long-term average in Prairie provinces as well as in Newfoundland & Labrador. By contrast, the measure remains well below its long-term average in Ontario and Prince Edward Island. In other provinces, sales and inventory are more balanced.
The Aggregate Composite MLS® Home Price Index (MLS® HPI) was up 1.6% y-o-y in December 2018. The increase is smaller but still broadly in line with y-o-y gains posted since July.
Apartment units posted the largest y-o-y price gains in December (+4.9%), followed by townhouse/row units (+3.1%). By comparison, two-storey single-family homes posted a small increase (+0.4%) while one-storey single-family home prices eased slightly (-0.3%).
Trends continue to vary widely among the 17 housing markets tracked by the MLS® HPI. Results were mixed in British Columbia. Prices are now down on a y-o-y basis in Greater Vancouver (-2.7%) but remain above year-ago levels in the Fraser Valley (+2.5%). Meanwhile, prices posted a y-o-y increase of 6.4% in Victoria and rose 11% elsewhere on Vancouver Island.
Among housing markets tracked by the index in the Greater Golden Horseshoe region, MLS® HPI benchmark home prices were up from year-ago levels in Guelph (+6.8%), the Niagara Region (+6.8%), Hamilton-Burlington (+6.4%), Oakville-Milton (+3.3%) and the GTA (+3%). Home prices in Barrie and District remain slightly below year-ago levels (-1.1%).
Across the Prairies where supply is historically elevated relative to sales, benchmark home prices remained below year-ago levels in Calgary(-3.2%), Edmonton (-2%), Regina (-5.2%) and Saskatoon (-1.2%). The home pricing environment is likely to remain weak in these housing markets until elevated supply is reduced and becomes more balanced in relation to demand.
Home prices rose 6.9% y-o-y in Ottawa (led by an 8.3% increase in townhouse/row unit prices), 6% in Greater Montreal (led by a 9.1% increase in townhouse/row unit prices) and 2.5% in Greater Moncton (led by a 12.2% increase in townhouse/row unit prices).
The MLS® HPI provides the best way to gauge price trends because average price trends are strongly distorted by changes in the mix of sales activity from one month to the next.
The actual (not seasonally adjusted) national average price for homes sold in December 2018 was just over $472,000, down 4.9% from the same month in 2017. The y-o-y decline reflects how the jump in sales in December 2017 in advance of the stress test was more pronounced in more expensive markets.
The national average price is heavily skewed by sales in Greater Vancouver and the GTA, two of Canada's most active and expensive markets. Excluding these two markets from calculations cuts almost $100,000 from the national average price, trimming it to just under $375,000.
SOURCE Canadian Real Estate Association
