
My Real Estate Blog - Market Trends, Tips & Updates
Canadian housing starts trended higher in July
8/14/2019 | Posted in Canadian Housing Market by Paul DeAdder | Back to Main Blog Page
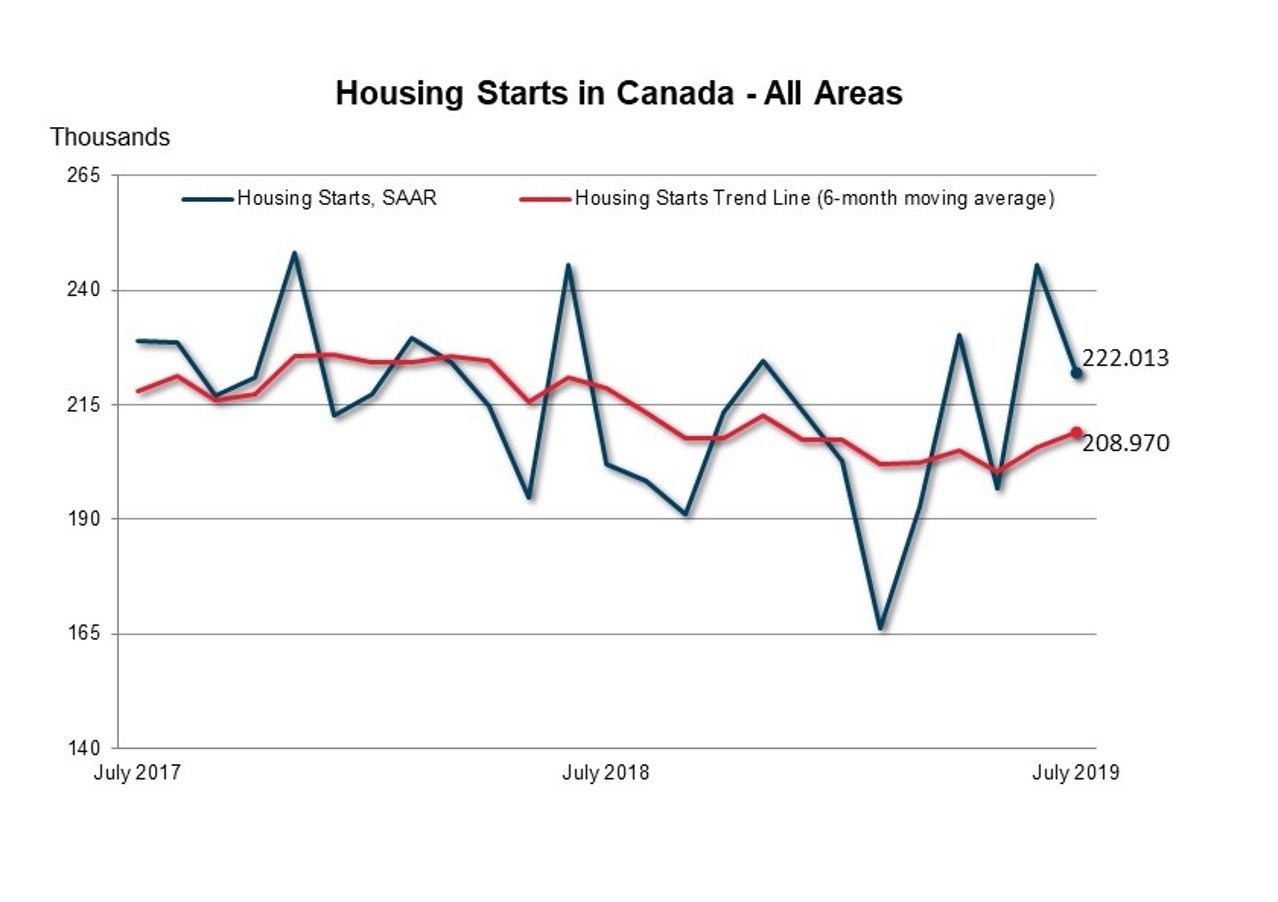
The trend in housing starts was 208,970 units in July 2019, compared to 205,765 units in June 2019, according to Canada Mortgage and Housing Corporation (CMHC). This trend measure is a six-month moving average of the monthly seasonally adjusted annual rates (SAAR) of housing starts.
"The national trend in housing starts increased in July, despite a decrease in the level of SAAR activity from June," said Bob Dugan, CMHC's chief economist. "High levels of activity in apartment and row starts in urban centres in recent months continued to be reflected in the high level of the total starts trend in July".
Monthly Highlights
Vancouver
Vancouver Census Metropolitan Area (CMA) housing starts continued to trend higher in July. Compared to the same period last year, the year-to-date single-detached home starts declined while the multi-unit starts increased. More than 85% of starts were multi-unit, most of which are in the City of Vancouver and the City of Surrey. Overall, continuous strengthening of economic fundamentals supported a steady growth of 25% in the year-to-date starts in the CMA between 2018 and 2019.
Victoria
Housing starts in the Victoria CMA declined in July, relative to the same month last year, across both the single-detached and multi-unit segments of the market. In the first seven months of 2019, housing starts were down approximately 12% relative to the same period in 2018. Continued overall strength in housing starts in the Victoria area is symptomatic of strong housing demand seen over the past three years and current strong demand for multi-unit options, in particular, in the area.
Lethbridge
The trend in total starts in the Lethbridge CMA was higher in July 2019 compared to the previous month. Apartment starts trended 360% higher compared to June as rental demand continue to increase. Single-detached and row starts trended lower while semi-detached starts remained stable.
Regina
Total housing starts in Regina trended lower in July after the pace of single-detached and multi-family construction slowed from the previous month. In 2019, builders have initiated just over a third of the total units started over the same period in 2018. This is largely due to higher construction costs and weaker economic conditions that have moderated new home demand and caused some projects to either be shelved or cancelled altogether.
Winnipeg
The trend in total housing starts in the Winnipeg CMA decreased in July compared to the previous month. The downward trend in total starts was mainly due to decreases in multi-family starts as both row and apartment starts trended lower. Single-family starts, however, trended higher but were not enough to offset the decreases in the multi-family units.
Toronto
Total housing starts trended lower in July in the Toronto CMA, primarily driven by lower multi-unit starts (semi-detached, rows, and apartments). Pre-construction sales of multi-unit homes, particularly condominium apartments, have been strong for the last few years and will break ground at a varying pace throughout the year. Strong demand for relatively affordable higher density housing continues to persist among homebuyers in Toronto.
St. Catharines
In July 2019, the total housing starts trend in the St. Catharines CMA inched lower. The total housing starts trend in recent months remained close to a 30-year high with townhomes accounting for the largest share. Improvements in employment conditions for people aged 25-44 fueled first-time home buying activity in relatively affordable home types such as townhomes.
Ottawa
The monthly trend for housing starts grew in Ottawa in July across all housing types. Year-to-date, total housing starts sit 5.3% higher than the same period last year with the strongest growth in condominium apartments followed by row starts. Low resale and rental market supply coupled with higher ownership costs for single-detached homes are encouraging construction of less expensive dwelling types.
Montréal
From January to July, housing starts in the Montréal area were up compared to the same period last year. This gain was solely attributable to rental housing construction, as condominium and single-family home starts recorded decreases. The low vacancy rates on the conventional rental market and the greater proportion of young households now opting for rental housing have kept stimulating rental housing starts. Seniors' rental apartment construction has also posted strong growth since the beginning of the year.
Saguenay
From January to July, housing starts in the Saguenay CMA dropped by 18% compared to the same period last year. This decrease in activity was attributable to fewer homeowner (freehold and condominium) housing starts. Overall, residential construction in the area has been limited by the slowdown in employment and low population growth.
New Brunswick
In New Brunswick, year-to-date total housing starts are up 40% compared to last year. The increase largely reflects unprecedented levels of rental apartment construction, particularly in Moncton and Saint John. These two CMAs alone accounted for 75% of all new multi-unit construction in the province. The number of multi-unit starts this year are the highest recorded in the first seven months since 2010. New Brunswick's urban centres are benefiting from provincial strategies to actively attract and retain immigrants. These new arrivals are boosting rental demand, in addition to demand from an aging population.
Prince Edward Island (PEI)
Total housing starts in PEI were 319% higher in July, due to the ongoing surge in new apartment construction activity in response to the Island's near zero vacancy rate. The PEI economy continues to outperform the other Atlantic Provinces, driven primarily by increased capital project spending and growth in population, income and employment.
CMHC uses the trend measure as a complement to the monthly SAAR of housing starts to account for considerable swings in monthly estimates and obtain a more complete picture of Canada's housing market. In some situations, analyzing only SAAR data can be misleading, as they are largely driven by the multi-unit segment of the market which can vary significantly from one month to the next.
The standalone monthly SAAR of housing starts for all areas in Canada was 222,013 units in July, down 9.6% from 245,455 units in June. The SAAR of urban starts decreased by 10.4% in July to 209,122 units. Multiple urban starts decreased by 12% to 162,722 units in July while single-detached urban starts decreased by 4.6% to 46,400 units.
Rural starts were estimated at a seasonally adjusted annual rate of 12,891 units.
|
Preliminary Housing Start Data in Centres 10,000 Population and Over |
||||||||||
|
Single-Detached |
All Others |
Total |
||||||||
|
July 2018 |
July 2019 |
% |
July 2018 |
July 2019 |
% |
July 2018 |
July 2019 |
% |
||
|
Provinces (10,000+) |
||||||||||
|
N.-L. |
64 |
41 |
-36 |
36 |
11 |
-69 |
100 |
52 |
-48 |
|
|
P.E.I. |
31 |
27 |
-13 |
5 |
124 |
## |
36 |
151 |
319 |
|
|
N.S. |
134 |
145 |
8 |
396 |
186 |
-53 |
530 |
331 |
-38 |
|
|
N.B. |
112 |
104 |
-7 |
112 |
165 |
47 |
224 |
269 |
20 |
|
|
Atlantic |
341 |
317 |
-7 |
549 |
486 |
-11 |
890 |
803 |
-10 |
|
|
Qc |
629 |
605 |
-4 |
2,214 |
3,154 |
42 |
2,843 |
3,759 |
32 |
|
|
Ont. |
2,029 |
1,867 |
-8 |
3,957 |
4,178 |
6 |
5,986 |
6,045 |
1 |
|
|
Man. |
218 |
202 |
-7 |
514 |
310 |
-40 |
732 |
512 |
-30 |
|
|
Sask. |
154 |
88 |
-43 |
81 |
37 |
-54 |
235 |
125 |
-47 |
|
|
Alta. |
1,094 |
839 |
-23 |
1,456 |
1,586 |
9 |
2,550 |
2,425 |
-5 |
|
|
Prairies |
1,466 |
1,129 |
-23 |
2,051 |
1,933 |
-6 |
3,517 |
3,062 |
-13 |
|
|
B.C. |
877 |
706 |
-19 |
2,661 |
3,630 |
36 |
3,538 |
4,336 |
23 |
|
|
Canada (10,000+) |
5,342 |
4,624 |
-13 |
11,432 |
13,381 |
17 |
16,774 |
18,005 |
7 |
|
|
Metropolitan Areas |
||||||||||
|
Abbotsford-Mission |
42 |
28 |
-33 |
111 |
218 |
96 |
153 |
246 |
61 |
|
|
Barrie |
169 |
43 |
-75 |
0 |
32 |
## |
169 |
75 |
-56 |
|
|
Belleville |
47 |
49 |
4 |
9 |
8 |
-11 |
56 |
57 |
2 |
|
|
Brantford |
37 |
74 |
100 |
21 |
14 |
-33 |
58 |
88 |
52 |
|
|
Calgary |
301 |
283 |
-6 |
709 |
408 |
-42 |
1,010 |
691 |
-32 |
|
|
Edmonton |
563 |
373 |
-34 |
518 |
988 |
91 |
1,081 |
1,361 |
26 |
|
|
Greater Sudbury |
22 |
26 |
18 |
8 |
18 |
125 |
30 |
44 |
47 |
|
|
Guelph |
10 |
25 |
150 |
81 |
53 |
-35 |
91 |
78 |
-14 |
|
|
Halifax |
74 |
81 |
9 |
330 |
148 |
-55 |
404 |
229 |
-43 |
|
|
Hamilton |
76 |
39 |
-49 |
226 |
85 |
-62 |
302 |
124 |
-59 |
|
|
Kelowna |
46 |
48 |
4 |
112 |
74 |
-34 |
158 |
122 |
-23 |
|
|
Kingston |
37 |
28 |
-24 |
26 |
61 |
135 |
63 |
89 |
41 |
|
|
Kitchener-Cambridge-Waterloo |
49 |
68 |
39 |
62 |
347 |
460 |
111 |
415 |
274 |
|
|
Lethbridge |
43 |
36 |
-16 |
8 |
107 |
## |
51 |
143 |
180 |
|
|
London |
156 |
151 |
-3 |
92 |
124 |
35 |
248 |
275 |
11 |
|
|
Moncton |
44 |
31 |
-30 |
20 |
89 |
345 |
64 |
120 |
88 |
|
|
Montréal |
253 |
247 |
-2 |
1,287 |
1,867 |
45 |
1,540 |
2,114 |
37 |
|
|
Oshawa |
51 |
99 |
94 |
68 |
42 |
-38 |
119 |
141 |
18 |
|
|
Ottawa-Gatineau |
339 |
320 |
-6 |
514 |
579 |
13 |
853 |
899 |
5 |
|
|
Gatineau |
38 |
44 |
16 |
247 |
256 |
4 |
285 |
300 |
5 |
|
|
Ottawa |
301 |
276 |
-8 |
267 |
323 |
21 |
568 |
599 |
5 |
|
|
Peterborough |
64 |
17 |
-73 |
0 |
95 |
## |
64 |
112 |
75 |
|
|
Québec |
70 |
70 |
- |
266 |
679 |
155 |
336 |
749 |
123 |
|
|
Regina |
29 |
19 |
-34 |
38 |
5 |
-87 |
67 |
24 |
-64 |
|
|
Saguenay |
32 |
15 |
-53 |
16 |
10 |
-38 |
48 |
25 |
-48 |
|
|
St. Catharines-Niagara |
53 |
72 |
36 |
12 |
53 |
342 |
65 |
125 |
92 |
|
|
Saint John |
19 |
26 |
37 |
52 |
0 |
-100 |
71 |
26 |
-63 |
|
|
St. John's |
46 |
25 |
-46 |
24 |
6 |
-75 |
70 |
31 |
-56 |
|
|
Saskatoon |
111 |
51 |
-54 |
27 |
16 |
-41 |
138 |
67 |
-51 |
|
|
Sherbrooke |
19 |
26 |
37 |
36 |
55 |
53 |
55 |
81 |
47 |
|
|
Thunder Bay |
28 |
9 |
-68 |
0 |
9 |
## |
28 |
18 |
-36 |
|
|
Toronto |
491 |
456 |
-7 |
2,872 |
2,315 |
-19 |
3,363 |
2,771 |
-18 |
|
|
Trois-Rivières |
13 |
18 |
38 |
44 |
32 |
-27 |
57 |
50 |
-12 |
|
|
Vancouver |
411 |
345 |
-16 |
1,746 |
2,353 |
35 |
2,157 |
2,698 |
25 |
|
|
Victoria |
97 |
46 |
-53 |
320 |
261 |
-18 |
417 |
307 |
-26 |
|
|
Windsor |
59 |
86 |
46 |
24 |
335 |
## |
83 |
421 |
407 |
|
|
Winnipeg |
173 |
169 |
-2 |
474 |
246 |
-48 |
647 |
415 |
-36 |
|
|
Total |
4,074 |
3,499 |
-14 |
10,153 |
11,732 |
16 |
14,227 |
15,231 |
7 |
|
|
Data based on 2016 Census Definitions. |
||||||||||
|
Source: Market Analysis Centre, CMHC |
||||||||||
|
## not calculable / extreme value |
||||||||||
|
Preliminary Housing Start Data - Seasonally Adjusted at Annual Rates (SAAR) |
||||||||||
|
Single-Detached |
All Others |
Total |
||||||||
|
June 2019 |
July 2019 |
% |
June 2019 |
July 2019 |
% |
June 2019 |
July 2019 |
% |
||
|
Provinces (10,000+) |
||||||||||
|
N.L. |
460 |
355 |
-23 |
228 |
85 |
-63 |
688 |
440 |
-36 |
|
|
P.E.I. |
274 |
215 |
-22 |
1,116 |
1,488 |
33 |
1,390 |
1,703 |
23 |
|
|
N.S. |
1,424 |
1,348 |
-5 |
5,859 |
2,162 |
-63 |
7,283 |
3,510 |
-52 |
|
|
N.B. |
611 |
635 |
4 |
4,388 |
1,853 |
-58 |
4,999 |
2,488 |
-50 |
|
|
Qc |
6,255 |
6,144 |
-2 |
45,875 |
41,713 |
-9 |
52,130 |
47,857 |
-8 |
|
|
Ont. |
18,267 |
18,899 |
3 |
46,950 |
49,044 |
4 |
65,217 |
67,943 |
4 |
|
|
Man. |
2,134 |
2,099 |
-2 |
6,948 |
3,720 |
-46 |
9,082 |
5,819 |
-36 |
|
|
Sask. |
1,119 |
801 |
-28 |
1,488 |
444 |
-70 |
2,607 |
1,245 |
-52 |
|
|
Alta. |
10,059 |
8,477 |
-16 |
20,108 |
18,783 |
-7 |
30,167 |
27,260 |
-10 |
|
|
B.C. |
8,039 |
7,427 |
-8 |
51,901 |
43,430 |
-16 |
59,940 |
50,857 |
-15 |
|
|
Canada (10,000+) |
48,642 |
46,400 |
-5 |
184,861 |
162,722 |
-12 |
233,503 |
209,122 |
-10 |
|
|
Canada (All Areas) |
56,838 |
55,957 |
-2 |
188,618 |
166,055 |
-12 |
245,455 |
222,013 |
-10 |
|
|
Metropolitan Areas |
||||||||||
|
Abbotsford-Mission |
413 |
321 |
-22 |
384 |
2,616 |
## |
797 |
2,937 |
269 |
|
|
Barrie |
166 |
204 |
23 |
0 |
384 |
## |
166 |
588 |
254 |
|
|
Belleville |
453 |
442 |
-2 |
336 |
96 |
-71 |
789 |
538 |
-32 |
|
|
Brantford |
77 |
484 |
## |
60 |
168 |
180 |
137 |
652 |
376 |
|
|
Calgary |
3,196 |
3,184 |
0 |
9,612 |
4,896 |
-49 |
12,808 |
8,080 |
-37 |
|
|
Edmonton |
4,737 |
3,954 |
-17 |
10,056 |
11,856 |
18 |
14,793 |
15,810 |
7 |
|
|
Greater Sudbury |
85 |
128 |
51 |
144 |
216 |
50 |
229 |
344 |
50 |
|
|
Guelph |
304 |
293 |
-4 |
156 |
636 |
308 |
460 |
929 |
102 |
|
|
Halifax |
797 |
755 |
-5 |
5,520 |
1,776 |
-68 |
6,317 |
2,531 |
-60 |
|
|
Hamilton |
542 |
381 |
-30 |
1,164 |
1,020 |
-12 |
1,706 |
1,401 |
-18 |
|
|
Kelowna |
703 |
618 |
-12 |
2,196 |
888 |
-60 |
2,899 |
1,506 |
-48 |
|
|
Kingston |
356 |
250 |
-30 |
0 |
732 |
## |
356 |
982 |
176 |
|
|
Kitchener-Cambridge-Waterloo |
835 |
979 |
17 |
2,916 |
4,164 |
43 |
3,751 |
5,143 |
37 |
|
|
Lethbridge |
371 |
349 |
-6 |
360 |
1,284 |
257 |
731 |
1,633 |
123 |
|
|
London |
1,155 |
1,442 |
25 |
3,732 |
1,488 |
-60 |
4,887 |
2,930 |
-40 |
|
|
Moncton |
161 |
185 |
15 |
2,508 |
1,068 |
-57 |
2,669 |
1,253 |
-53 |
|
|
Montréal |
2,336 |
2,572 |
10 |
37,393 |
22,387 |
-40 |
39,729 |
24,959 |
-37 |
|
|
Oshawa |
1,208 |
965 |
-20 |
936 |
504 |
-46 |
2,144 |
1,469 |
-31 |
|
|
Ottawa-Gatineau |
2,671 |
3,164 |
18 |
7,776 |
6,948 |
-11 |
10,447 |
10,112 |
-3 |
|
|
Gatineau |
491 |
440 |
-10 |
972 |
3,072 |
216 |
1,463 |
3,512 |
140 |
|
|
Ottawa |
2,180 |
2,724 |
25 |
6,804 |
3,876 |
-43 |
8,984 |
6,600 |
-27 |
|
|
Peterborough |
117 |
119 |
2 |
84 |
1,140 |
## |
201 |
1,259 |
## |
|
|
Québec |
756 |
830 |
10 |
10,812 |
8,148 |
-25 |
11,568 |
8,978 |
-22 |
|
|
Regina |
219 |
182 |
-17 |
528 |
60 |
-89 |
747 |
242 |
-68 |
|
|
Saguenay |
186 |
138 |
-26 |
360 |
120 |
-67 |
546 |
258 |
-53 |
|
|
St. Catharines-Niagara |
1,256 |
667 |
-47 |
696 |
636 |
-9 |
1,952 |
1,303 |
-33 |
|
|
Saint John |
127 |
188 |
48 |
864 |
0 |
-100 |
991 |
188 |
-81 |
|
|
St. John's |
356 |
231 |
-35 |
300 |
72 |
-76 |
656 |
303 |
-54 |
|
|
Saskatoon |
713 |
523 |
-27 |
912 |
192 |
-79 |
1,625 |
715 |
-56 |
|
|
Sherbrooke |
387 |
388 |
0 |
432 |
660 |
53 |
819 |
1,048 |
28 |
|
|
Thunder Bay |
106 |
56 |
-47 |
48 |
108 |
125 |
154 |
164 |
6 |
|
|
Toronto |
5,417 |
5,247 |
-3 |
29,520 |
27,780 |
-6 |
34,937 |
33,027 |
-5 |
|
|
Trois-Rivières |
234 |
227 |
-3 |
72 |
384 |
433 |
306 |
611 |
100 |
|
|
Vancouver |
3,602 |
3,616 |
0 |
37,896 |
28,236 |
-25 |
41,498 |
31,852 |
-23 |
|
|
Victoria |
675 |
516 |
-24 |
1,788 |
3,132 |
75 |
2,463 |
3,648 |
48 |
|
|
Windsor |
546 |
760 |
39 |
216 |
4,020 |
## |
762 |
4,780 |
## |
|
|
Winnipeg |
1,762 |
1,783 |
1 |
6,660 |
2,952 |
-56 |
8,422 |
4,735 |
-44 |
|
|
Data based on 2016 Census Definitions. |
||||||||||
|
Source: Market Analysis Centre, CMHC |
||||||||||
|
## not calculable / extreme value |
||||||||||
Source: CMHC
